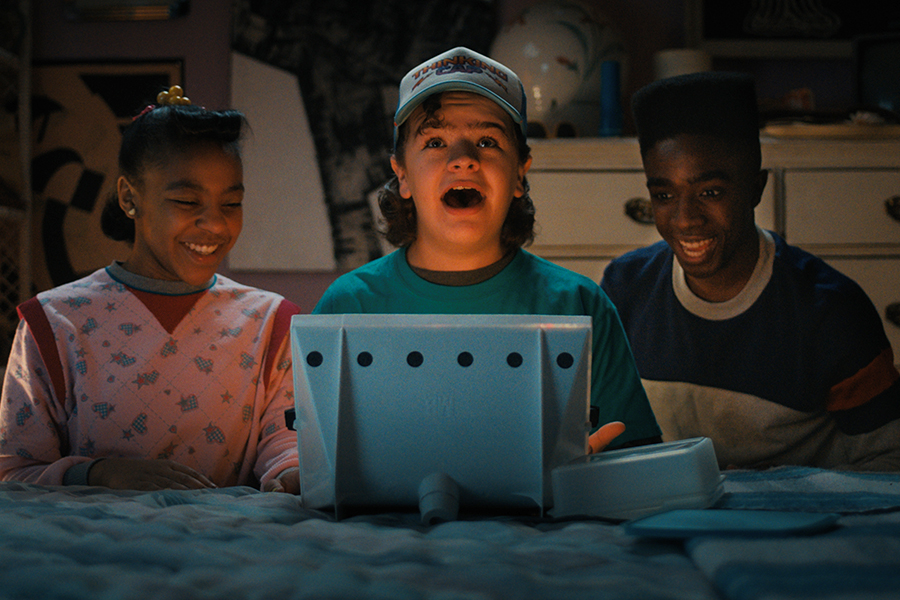
“Stranger Things”
May 15, 2023
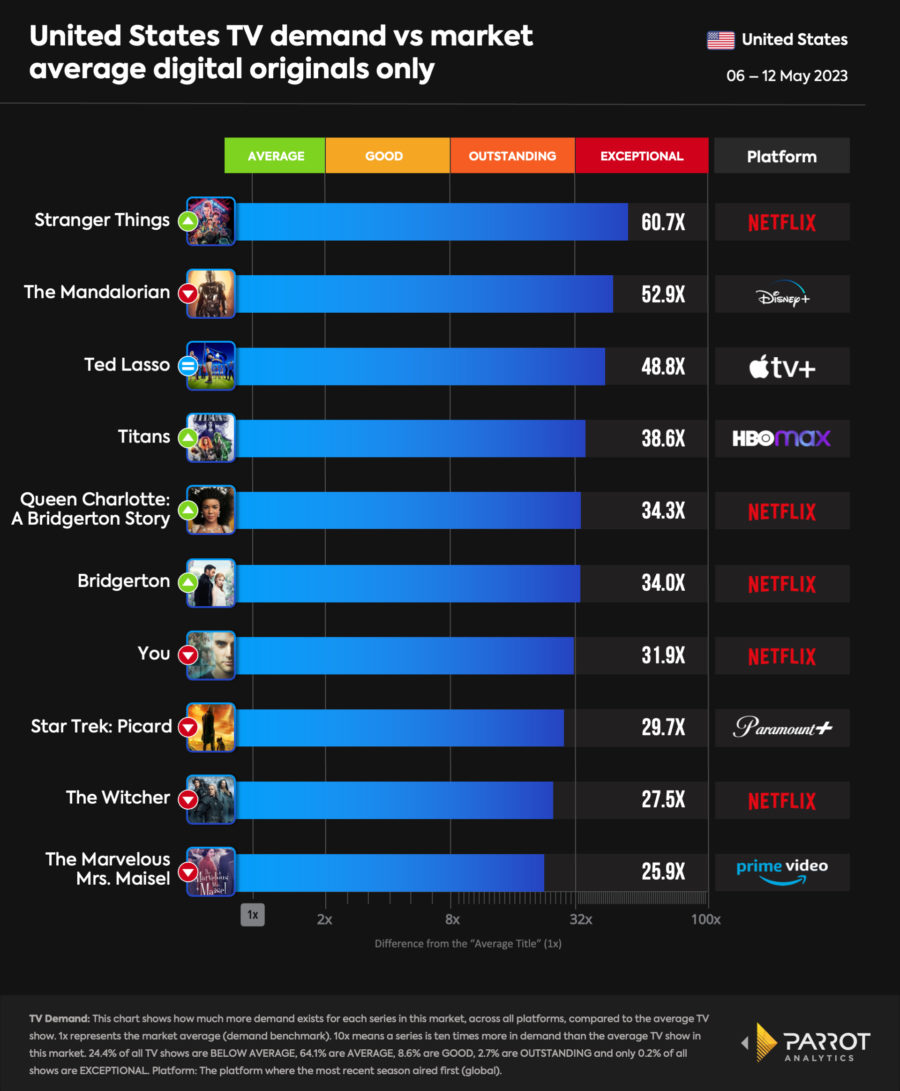
Netflix’s supernatural thriller “Stranger Things” returned to the No. 1 spot on Parrot Analytics’ digital originals U.S. rankings the week ended May 12. It had a 5.5% rise in demand expressions, the proprietary metric Parrot uses to gauge a show’s popularity, giving it 60.7 times the demand of an average series. The week saw news that production on the fifth and final season is on hold due to the writers strike. “Stranger Things” was No. 5 on Parrot’s list of overall TV shows.
The Disney+ “Star Wars” series “The Mandalorian” fell to No. 2 on the digital originals chart. Now that the third season has concluded, it had an 8.8% drop in demand expressions, giving it 52.9 times the demand of an average series. “The Mandalorian” was No. 8 on Parrot’s list of overall TV shows.
Again No. 3 on the digital originals chart was the Apple TV+ comedy “Ted Lasso,” which had a 2.6% drop in demand expressions to give it 48.8 times average demand as its third season continues.
Up a spot to No. 4 was HBO Max’s “Titans.” The superhero show, which had its series finale May 11, had a 5.7% rise in demand expressions to give it 38.6 times average demand.
The biggest jump into the top 10 was Netflix’s “Queen Charlotte: A Bridgerton Story,” with a 229% spike in demand expressions
A “digital original” is Parrot’s term for a multi-episode series in which the most recent season was first made available on a streaming platform such as Netflix, Amazon Prime Video, Hulu or Disney+.
The No. 1 overall TV series in terms of online demand was “SpongeBob SquarePants” with 86.6 times average demand.
Subscribe HERE to the FREE Media Play News Daily Newsletter!
Media Play News has teamed with Parrot Analytics to provide readers with a weekly top 10 of the most popular digital original TV series in the United States, based on the firm’s proprietary metric called Demand Expressions, which measures demand for TV content in a given market through a wide variety of data sources, including video streaming, social media activity, photo sharing, blogging, commenting on fan and critic rating platforms, and downloading and streaming via peer-to-peer protocols and file sharing sites. Results are expressed as a comparison with the average demand for a TV show of any kind in the market.